
The Case for Density in Sydney's Middle Ring
The question of where we locate density is a contest.
If you’ve been watching Sydney for long enough, you will have realised that current strategies for density are determined, not by sound planning principles or equity, but political expedience; notably where density is least likely to be contested. You will be familiar with the evidence; along busy roads, by converting industrial land, by subdividing pastures at the periphery of the city, or as tower development in retail cores centered over just a few blocks of a few key railway stations.
These strategies are proportional only to the absence of objectors, and do not put people in places that are good to live in, or where they would necessarily choose to live. They impose great inequity on our City.
This article explores this inequity through just 4 maps of Sydney. These maps not only reinforce the value of Sydney’s middle ring suburbs as places suited to greater density, but also the consequences and inequity of propelling our urban sprawl.
So, to the maps…
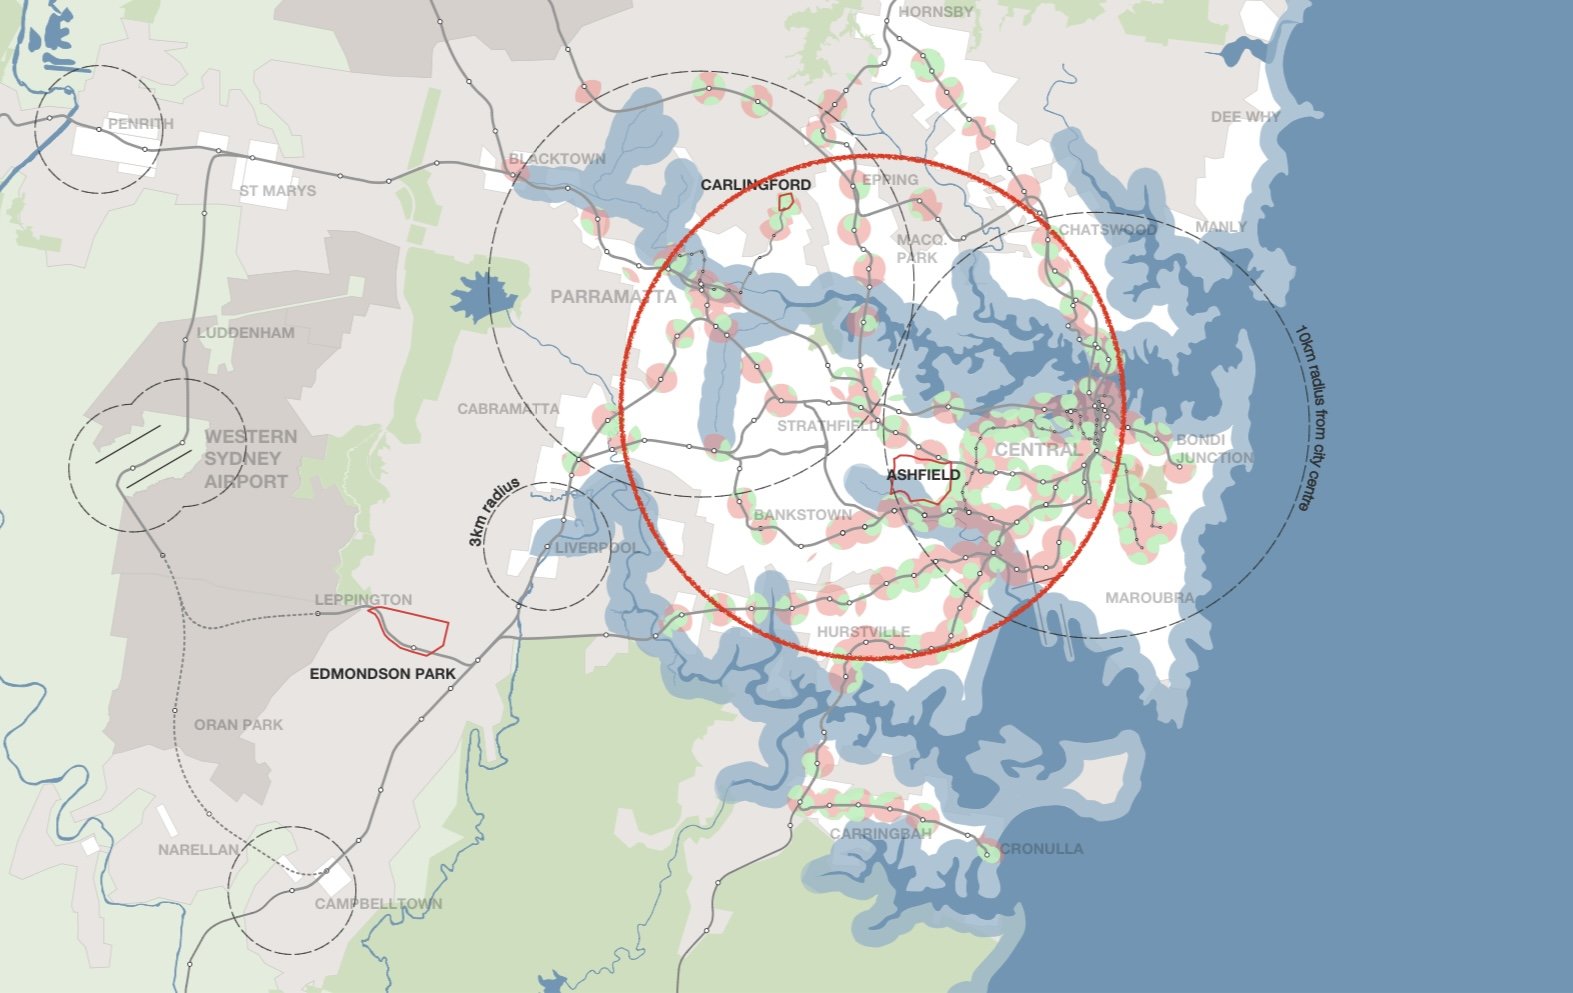
Map 1. Urban Amenity - drawing c/- Hill Thalis Architecture & Urban Projects for GANSW
Map 1. Measuring Urban Amenity (above). Red dots represent places around railways stations (10 minutes walk / 800m) where you can catch the train home, and pick up milk and bread on the way (street based retail), and walk the kids to a park before dinner (small green dots - 5min walk).
The red circle is a 12km radius centred on Strathfield (consistently shown on all 4 maps); Not so much of a ‘middle ring’ but a ‘middle bubble’ capturing what architects and urban designers refer to as ‘good urban amenity’. The white area is the 1950s metropolitan area of Sydney. While the Grey areas represents areas of subsequent expansion (2010-lighter / 2021-darker).
This ‘Bubble’ captures; Epping to the north, Hurstville to the south, and the edge of Parramatta to the west. Importantly these areas (inside the bubble) were enabled by railway built almost 100 years earlier to facilitate the city's expansion, prior to prevalence in car ownership, and are inherently walkable.
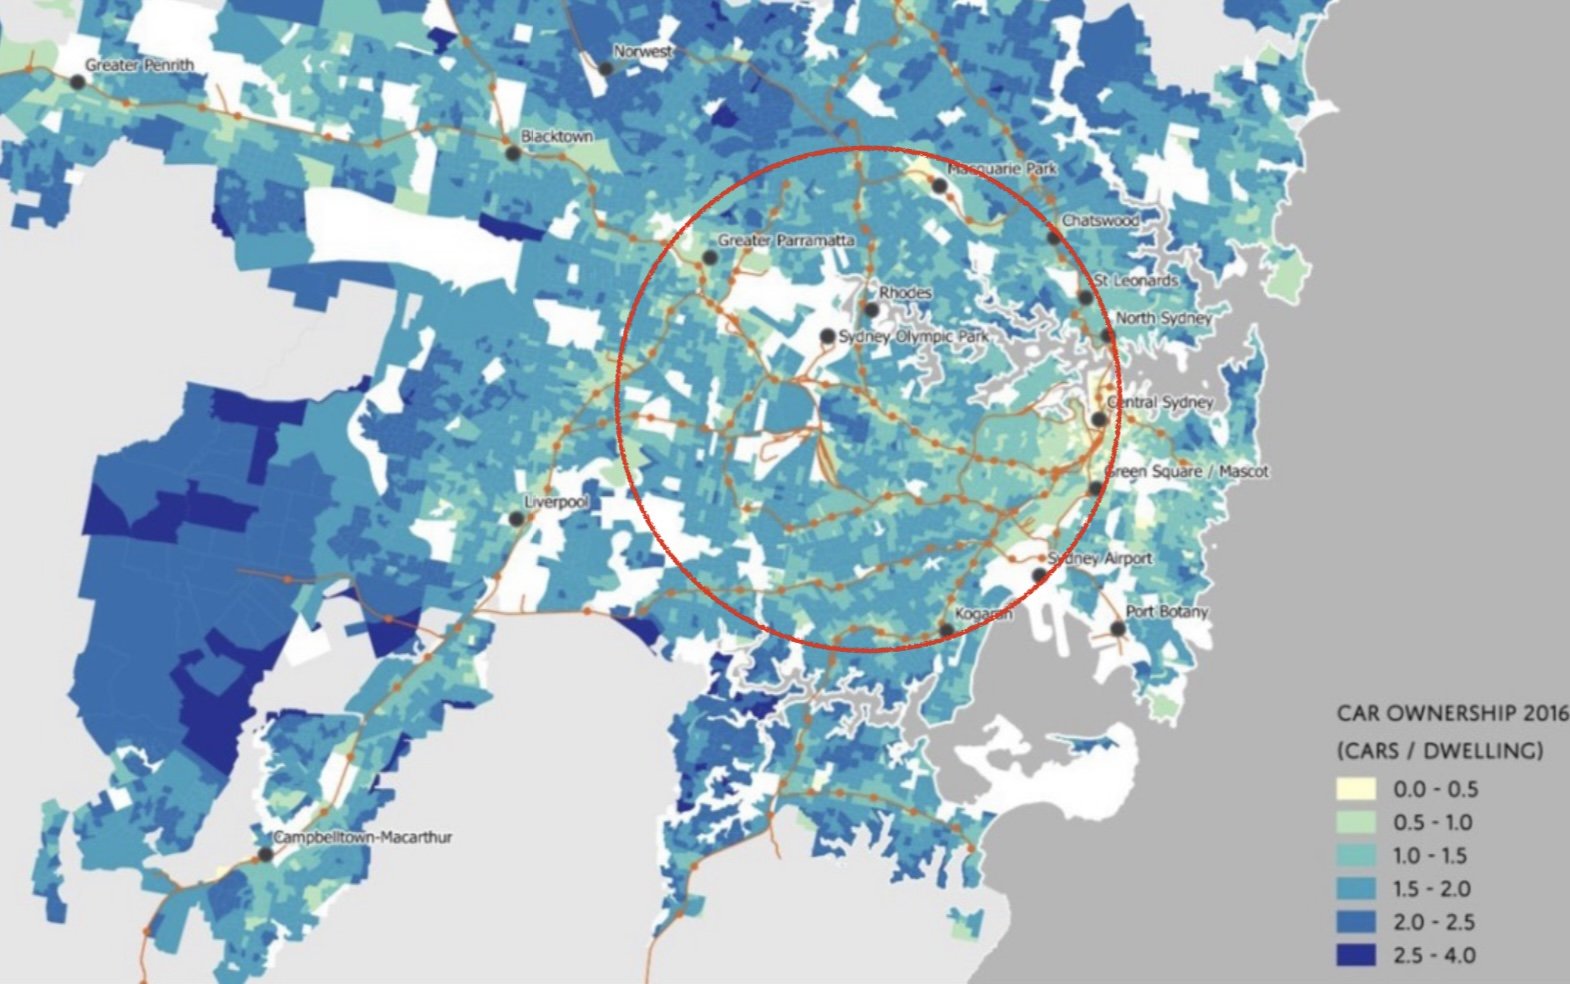
Map 2. Car ownership per household c/- Greater Sydney Commission (disbanded).
Map 2. Car ownership per household unsurprisingly goes down around these stations. As low as 0.5 cars per dwelling. Note area outside the ‘bubble’. Car ownership goes as high as 4 cars per household.
So, considering the area outside the bubble; you need to drive home, and to get milk & bread, and the time at the park before dinner is spent commuting by car, for the ‘privilege’ of home ownership in these parts.
So let’s see how this might translate to affordability…

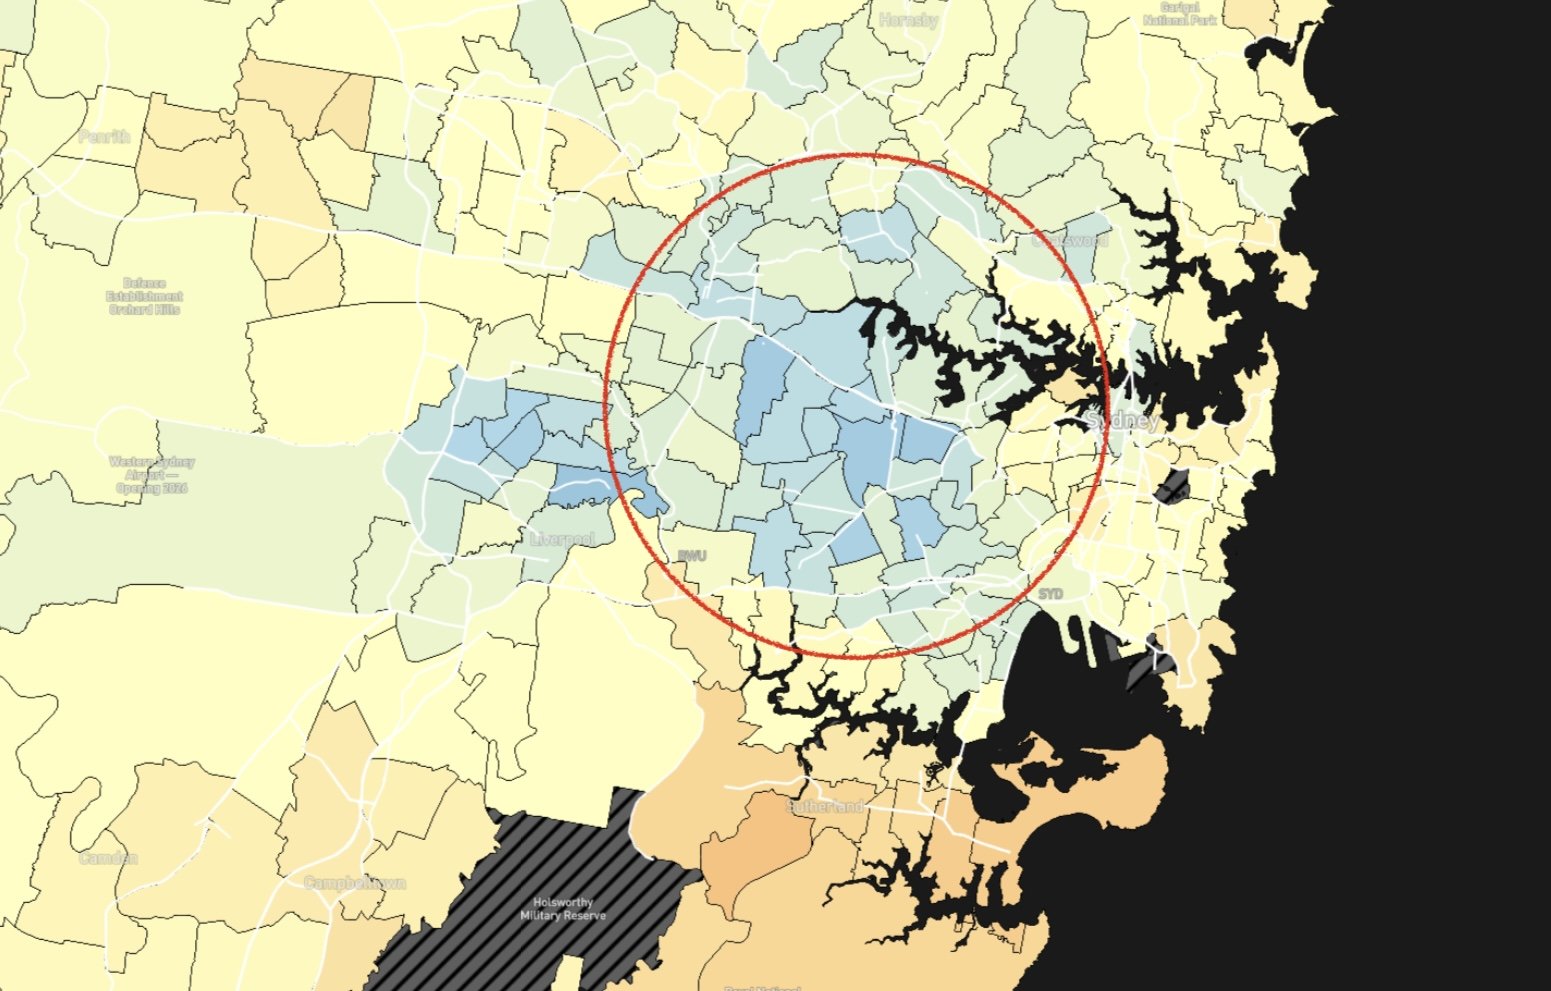
Map 3. Mortgage Stress c/- Everybody's Home
Map 3. Mortgage Stress. Darker blue areas represent places of highest mortgage stress. So more affordable housing in these areas outside the bubble does not translate to broader affordability. There are consequences! People are literally paying for it elsewhere and with ‘stress’.
So how might the impact of this stress and lifestyle be measured? We can look at ‘lifestyle diseases’ occurrence. Let’s see….
Map 4. Cancer Occurrence c/- Australian Cancer Atlas
Map 4. Cancer occurrence measured against national averages. Blue is below national average, orange is above. So, ‘stress’ associated with this inequity in lifestyle has a detrimental impact on our society, where the ‘stress’ has consequences and costs (eg. Healthcare, road tolls, car ownership, etc.) that are pushed onto our most disadvantaged.
So….
It is unsustainable and inequitable to continue along our current path. Sydney’s ‘middle’ is prized and valuable and we need to find a way to share it to redress the political expediency.